Thanks to John Heffron, this site now has detailed stats on the components for the plus-minus figures.
For each player page, and for the season overview pages, there will be 4 new figures for each
player/season. These new stats can be seen in the image below :
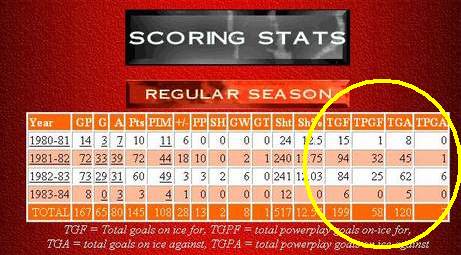
The new stats are:
TGF - total goals the player was on-ice for
TPGF - total powerplays goals the player was on-ice for
TGA - total goals against the player was on-ice
TPGA - total powerplay goals against the player was on-ice
The plus-minus stat is calculated by the formula (TGF-TPGF) - (TGA - TPGA)
Looks complicated but it's basically the total non-powerplay goals for a player was on ice minus the total non-powerplay goals against that the player was on the ice.
These stats will be computed and added at the conclusion of each season
We can now look at some obscure facts with this new set of data.
The highest TGF value by a Flyer in a season ... 1985-1986 Mark Howe - 188
The highest TPGF value by a Flyer in a season ... 1985-1986 Tim Kerr - 78
The highest TGA value by a Flyer in a season ... 1992-93 Garry Galley - 142
The highest TPGA value by a Flyer in a season ... 1992-93 Garry Galley - 56
The highest plus component (TGF-TPGF) by a Flyer in a season ... tie - 1985-86 Mark Howe and Brad McCrimmon - 142 (next highest was only 117)
The highest minus component (TGA-TPGA) by a Flyer in a season - 1992-93 Mark Recchi - 105
Derian Hatcher's 133 TGA total for the horrible 2006-07 season is tied for 3rd worst, with Garry Galley's 1993-94 total. Surprising Rod Brind'Amour had the second worst at 137 for the 1993-94 season.
In the 74-75 season Clarke was on ice for 98 non-powerplay goals and for only 19 non-powerplay goals against. For 1975-76 it was 105 vs 22. That results in an incredible ratio of 5.15 and 4.77. He was on-ice for around 5 times more goals than goals against !
If you look at the best seasons for ALL other NHL players since '67 with a plus-minus of at least 25, the next best ratio was 1977 Rick Chartraw who's 37 vs 10 gave a 3.7 ratio. Bobby Orr's league record +127 in 1971 was a result of a 179 vs 55 or a 3.25 ratio. Clarke was more than 50% better !
Moving on to career totals (as a Flyer)
Top Career TGF
Bobby Clarke - 1648
Bill Barber - 1361
Brian Propp - 1270
Mark Howe - 1141
Eric Desjardins - 994
Top Career TPGF
Bobby Clarke - 513
Bill Barber - 484
Brian Propp - 410
Tim Kerr - 376
John LeClair - 338
Top Career TGA
Bobby Clarke - 1021
Bill Barber - 840
Rod Brind'Amour - 784
Joe Watson - 774
Eric Desjardins - 760
Top Career TPGA
Bobby Clarke - 392
Bill Barber - 279
Rod Brind'Amour - 254
Mark Howe - 251
Kjell Samuelsson - 247
Top Career Plus Component (TGF - TPGF)
Bobby Clarke - 1135
Bill Barber - 877
Brian Propp - 860
Mark Howe - 820
Joe Watson - 719
Top Career Minus Component (TGA - TPGA)
Bobby Clarke - 629
Bill Barber - 561
Brian Propp - 549
Rod Brind'Amour - 530
Joe Watson - 528
|